ichimoku: Beyond Visualization - Quantitative Strategies
Source:vignettes/strategies.Rmd
strategies.RmdIntroduction
There are multiple ways to work with Ichimoku Kinko Hyo strategies using the ichimoku R package.
First and foremost is visually, and the functions for visualization are described in the reference vignette.
However, for performing analysis on the data directly, complications of the ichimoku system can quickly become apparent. The Chikou span in particular poses a challenge as the position of this indicator needs to be mapped in relation to the chart elements 26 periods previously, however this then affects trading decisions at the present point in time.
The ‘strategy layer’ of the ichimoku package aims to prepare the data in a standardized format for ease of further analysis. Short strategy summaries are generated automatically, but are designed to serve as a quick reference rather than a replacement for a full backtest using a package such as ‘PerformanceAnalytics’.
The autostrat() function is used to further facilitate
idea generation, and leverages the computational capability of R to
simultaneously test all valid indicator combinations.
Risk warning: past results are not necessarily indicative of future performance, and should always be considered within the context of a comprehensive risk analysis framework.
Working with Strategies
1. Use ichimoku()
To create an ichimoku object from the price data.
# Simulated OHLC pricing data is assigned to data frame 'TKR':
TKR <- sample_ohlc_data
cloud <- ichimoku(TKR)
2a. Simple strategies using strat()
To test a simple strategy with an indicator condition of the form ‘long (or short) while c1 > c2’.
Here ‘c1’ and ‘c2’ are the quoted column names of the ichimoku object representing either candlestick values e.g. ‘close’ or cloud values e.g. ‘tenkan’.
Note: the indicator condition remains of the form c1 > c2 even for short trades. Hence please take care, for example, when inverting ‘long while close > tenkan’ to ‘short while close < tenkan’, this should actually be formulated as ‘short while tenkan > close’.
strat <- strat(cloud, c1 = "cloudB", c2 = "kijun")
print(strat[100:105, ], plot = FALSE)
#>  ichimoku   [ more() to display more rows | look() to inspect attributes ]
#>   object
#>                      open  high   low close cd tenkan  kijun senkouA senkouB
#> 2020-05-19 23:00:00 122.7 122.7 121.8 122.4 -1 121.05 123.90 125.675  124.85
#> 2020-05-20 23:00:00 122.4 122.6 121.1 121.9 -1 121.05 123.90 125.675  124.85
#> 2020-05-21 23:00:00 121.9 123.7 121.7 123.3  1 121.40 123.80 125.675  124.85
#> 2020-05-24 23:00:00 123.3 124.0 123.0 124.0  1 121.55 123.80 125.675  124.85
#> 2020-05-25 23:00:00 124.2 124.3 124.0 124.1 -1 121.75 123.65 125.975  124.85
#> 2020-05-26 23:00:00 124.1 124.1 123.4 123.9 -1 122.25 123.65 126.475  124.85
#>                     chikou  cloudT cloudB cond posn txn        logret
#> 2020-05-19 23:00:00  135.1 125.675 124.85    1    1   0 -0.0024479816
#> 2020-05-20 23:00:00  135.6 125.675 124.85    1    1   0 -0.0040933336
#> 2020-05-21 23:00:00  134.5 125.675 124.85    1    1   0  0.0114193737
#> 2020-05-24 23:00:00  134.3 125.675 124.85    1    1   0  0.0072727593
#> 2020-05-25 23:00:00  135.9 125.975 124.85    1    1   0 -0.0008054773
#> 2020-05-26 23:00:00  135.2 126.475 124.85    1    1   0 -0.0016129036
#>                           slogret          ret         sret
#> 2020-05-19 23:00:00 -0.0024479816 -0.002444988 -0.002444988
#> 2020-05-20 23:00:00 -0.0040933336 -0.004084967 -0.004084967
#> 2020-05-21 23:00:00  0.0114193737  0.011484824  0.011484824
#> 2020-05-24 23:00:00  0.0072727593  0.007299270  0.007299270
#> 2020-05-25 23:00:00 -0.0008054773 -0.000805153 -0.000805153
#> 2020-05-26 23:00:00 -0.0016129036 -0.001611604 -0.001611604
The use of strat() returns an augmented ichimoku object.
The printout above of a slice of the object (rows 100 to 105) shows that
the following columns are appended:
-
$cond: ‘1’ if the indicator condition is met at the close of the the time period (note: if the indicator condition involves chikou span, the comparison will be of past periods) -
$posn: ‘1’ represents that a position is held during this time period (i.e. from the ‘open’ to the ‘close’) -
$txn: ‘1’ represents a transaction to enter a new position, ‘-1’ represents a transaction to exit an existing position. All transactions are assumed to happen at the ‘open’ of the respective period -
$logret: the log returns from the ‘open’ price of the period to the ‘open’ price of the next period. For the avoidance of doubt, ‘log returns’ means the natural logarithm of the difference between the prices -
$slogret: the log returns for the strategy. It is simply logret * posn, i.e. the returns where a position is held -
$ret: the discrete returns from the ‘open’ price of the period to the ‘open’ price of the next period. For the avoidance of doubt, this is calculated as e raised to the power of ‘logret’ minus 1 -
$sret: the discrete returns for the strategy. It is simply ret * posn, i.e. the returns where a position is held
Note: the following assumptions apply to all strategies:
- confirmation of whether a condition is satisfied is received at the ‘close’ of a particular period
- a transaction is initiated at the immediately following ‘open’
- all transactions are conducted at opening prices
All events are aligned to their correct time periods, which are taken to be from the ‘open’ to the ‘close’ inclusive of that period:
- ‘cond’ refers to if the condition is satisfied at the ‘close’ of the period
- ‘posn’ refers to whether a position is held at the ‘close’ of the period
- ‘txn’ refers to if there has been a transaction during the period (occurring at the ‘open’)
2b. Complex strategies using strat()
Complex strategies can be created by strat() simply by
supplying ‘c3’ and ‘c4’ to the function. These are the quoted column
names of the ichimoku object that form the second part of the indicator
condition.
To create the desired complex strategy, the argument ‘type’ must also be specified. By default this is set to 2, which means the strategy will be a combined strategy formulated as ‘c1 > c2 & c3 > c4’, where both conditions must be satisfied.
If ‘type’ is set to 3, the strategy will be formulated as an asymmetric strategy ‘c1 > c2 x c3 > c4’, where ‘c1 > c2’ is used as a position entry indicator, and ‘c3 > c4’ as a position exit indicator.
- Note: when the strategy is, for example, ‘close > tenkan x tenkan > close’, this is equivalent to the simple strategy ‘close > tenkan’ but not identical due to the strict inequality. In the former, the situation ‘close = tenkan’ does not trigger a position exit but in the latter it does
3. View strategy summary with summary()
A summary of the strategy is saved as an attribute to the ichimoku
object and can be accessed by the summary() method for
ichimoku objects.
summary(strat)
#>                        [,1]
#> Strategy               "cloudB > kijun"
#> ---------------------  "----------"
#> Strategy cuml return % 14.09
#> Per period mean ret %  0.0741
#> Periods in market      46
#> Total trades           3
#> Average trade length   15.33
#> Trade success %        100
#> Worst trade ret %      3.4
#> ---------------------  "----------"
#> Benchmark cuml ret %   5.53
#> Per period mean ret %  0.0302
#> Periods in market      178
#> ---------------------  "----------"
#> Direction              "long"
#> Start                  2020-04-19 23:00:00
#> End                    2020-12-23
#> Ticker                 "TKR"
The summary is designed to provide a quick overview of whether a strategy is effective / desirable:
- Strategy returns are compared with the benchmark, which is simply holidng a position throughout the period
- Comparing returns combined with total periods in the market can help determine if the strategy is substantially different from just taking market risk
- Total trades along with average trade length can be used to filter out undesirable strategies that over-trade
- Trade success % helps to characterise the consistency of the strategy or whether it relies on a small percentage of outsize returns
- The return of the worst-performing trade provides a measure of downside risk
See strategy summary specification for details of the reported measures.
4. Visualize by calling plot() or
iplot().
plot(strat, theme = "dark")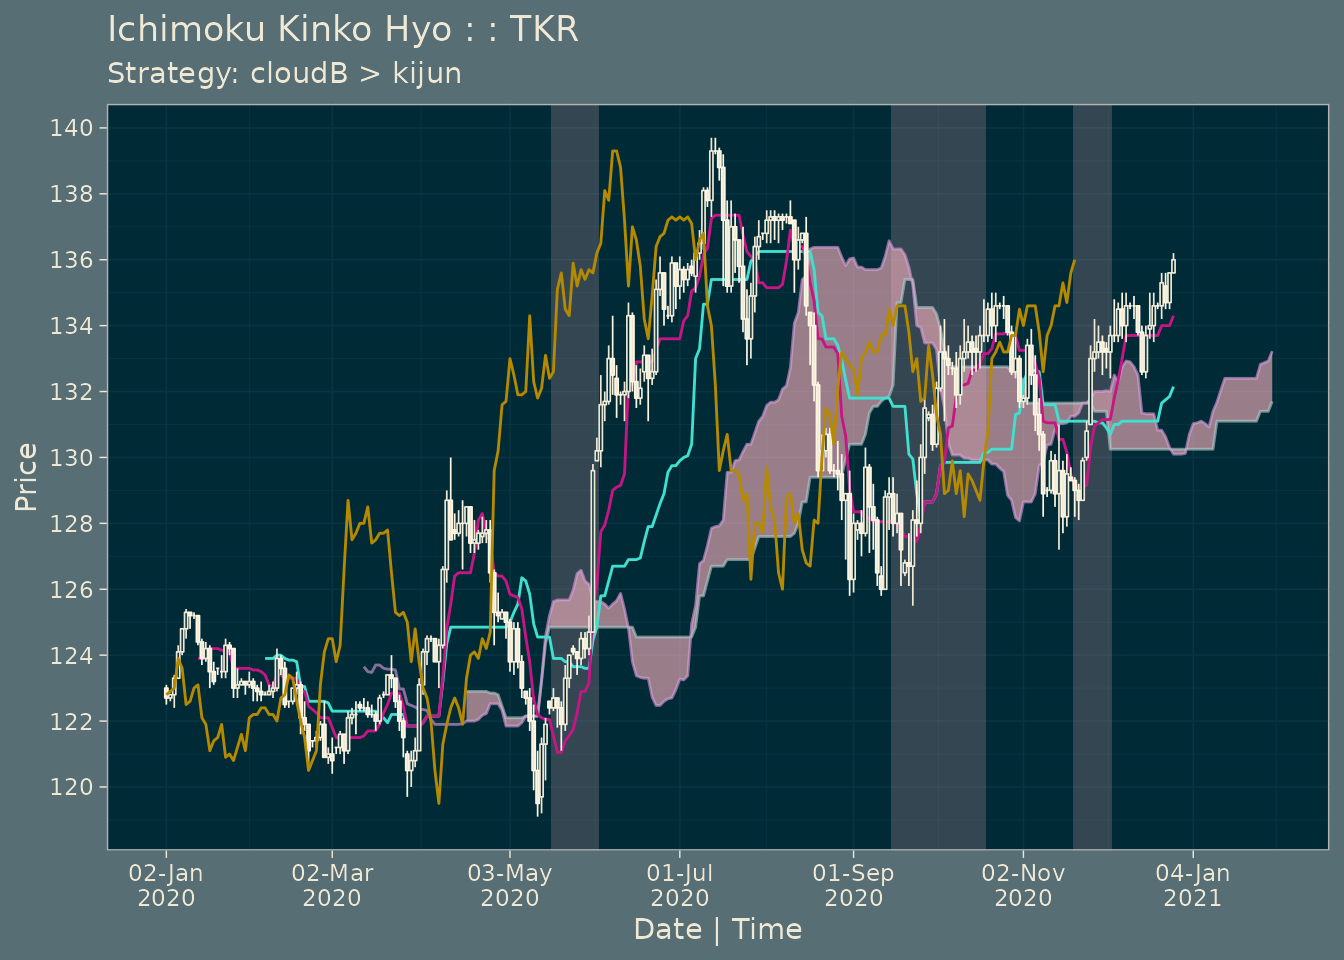
The periods where the strategy results in a market position are now shaded on the ichimoku cloud chart. The strategy is also printed as the chart subtitle (if not otherwise specified).
To view the original chart without the strategy, simply pass the
argument strat = FALSE when calling plot() or
iplot().
5. Combine strategies using stratcombine()
stratcombine() can be used to create custom combined
strategies from existing strategies contained in ichimoku objects ‘s1’
and ‘s2’ to form ‘s1 & s2’.
strat2 <- strat(cloud, "kijun", "tenkan")

newstrat <- stratcombine(strat, strat2)
summary(newstrat)
#>                        [,1]
#> Strategy               "cloudB > kijun & kijun > tenkan"
#> ---------------------  "----------"
#> Strategy cuml return % 11.53
#> Per period mean ret %  0.0613
#> Periods in market      27
#> Total trades           3
#> Average trade length   9
#> Trade success %        100
#> Worst trade ret %      1.78
#> ---------------------  "----------"
#> Benchmark cuml ret %   5.53
#> Per period mean ret %  0.0302
#> Periods in market      178
#> ---------------------  "----------"
#> Direction              "long"
#> Start                  2020-04-19 23:00:00
#> End                    2020-12-23
#> Ticker                 "TKR"
Note: rather than combining simple strategies using
stratcombine(), it is preferable to supply all 4 arguments
‘c1’, ‘c2’, ‘c3’, and ‘c4’ directly to strat() to generate
a strategy of ‘c1 > c2 & c3 > c4’.
6. Further backtesting and returns analysis
The strategy returns are saved within the ichimoku object in the columns ‘slogret’ (strategy log returns) and ‘sret’ (strategy discrete returns).
The benchmark returns for all periods are saved as ‘logret’ (log returns) and ‘ret’ (discrete returns).
As the ichimoku object inherits the ‘xts’ class, these columns may be fed directly into other econometrics or time series analysis packages such as ‘PerformanceAnalytics’, as per the example below.
library(PerformanceAnalytics)
# To chart performance comparison of strategy vs benchmark, daily returns and drawdowns
charts.PerformanceSummary(strat[, c("sret", "ret")])
# For a table detailing drawdowns, including depth, length of recovery etc.
table.Drawdowns(strat[, "sret"])
Advanced Strategies and ML
autostrat()
The analytic capability of R can be leveraged to generate and evaluate all possible strategies. This function is designed for simplicity and can be called on an ichimoku object without any additional arguments. The optional arguments it does take are limited to:
-
n[default 8] number of strategies to return -
dir[default ‘long’] trade direction ‘long’ or ‘short’ -
level[default 1] to return simple strategies. For complex strategies, setlevel = 2to return combined strategies of the form ‘s1 & s2’ orlevel = 3to return asymmetric strategies of the form ‘s1 x s2’ -
quietlyif set to TRUE, will suppress printing of additional output to the console and return quietly
autostrat(cloud, n = 3)
#>                        [,1]                [,2]
#> Strategy               "senkouB > tenkan"  "cloudB > tenkan"
#> ---------------------  "----------"        "----------"
#> Strategy cuml return % 17.49               16.08
#> Per period mean ret %  0.0906              0.0838
#> Periods in market      63                  51
#> Total trades           3                   3
#> Average trade length   21                  17
#> Trade success %        100                 100
#> Worst trade ret %      3.64                3.16
#> ---------------------  "----------"        "----------"
#> Benchmark cuml ret %   5.53                5.53
#> Per period mean ret %  0.0302              0.0302
#> Periods in market      178                 178
#> ---------------------  "----------"        "----------"
#> Direction              "long"              "long"
#> Start                  2020-04-19 23:00:00 2020-04-19 23:00:00
#> End                    2020-12-23          2020-12-23
#> Ticker                 "TKR"               "TKR"
#>                        [,3]
#> Strategy               "senkouB > kijun"
#> ---------------------  "----------"
#> Strategy cuml return % 14.1
#> Per period mean ret %  0.0741
#> Periods in market      64
#> Total trades           3
#> Average trade length   21.33
#> Trade success %        100
#> Worst trade ret %      3.49
#> ---------------------  "----------"
#> Benchmark cuml ret %   5.53
#> Per period mean ret %  0.0302
#> Periods in market      178
#> ---------------------  "----------"
#> Direction              "long"
#> Start                  2020-04-19 23:00:00
#> End                    2020-12-23
#> Ticker                 "TKR"
The output of autostrat() is a list of ichimoku objects.
Each object may be accessed by its position in the list
e.g. [[1]] for the first object.
The metadata is also saved as attributes to the list and can be
accessed by the function look():
logret: the log returns of all combinations computed by autostrat
summary: the strategy summaries
Note: the strategies returned may not be in order of strategy returns
as displayed in the strategy summaries. This is due to the fact that the
implementation via mlgrid() simultaneously tests all
strategies using the same time interval for comparability. However
individual strategies are then run on the top ‘n’ strategies using all
of the available data for those indicators, which may be more than that
used during comparison.
Note: as SenkouA, SenkouB, cloudT and cloudB are used in conjunction with other indicators, it is possible to get a series of similar returns with cloudB > close, senkouB > close etc. Although these strategies may at times be equivalent or considered equivalent, this is not always the case and all such results are returned.
autostrat() Levels 2 and 3
Set the argument level = 2 to autostrat()
to test all strategies with a combination of up to 2 indicator
conditions, i.e. strat() with type = 2.
autostrat(cloud, n = 3, dir = "short", level = "2")
#>                        [,1]
#> Strategy               "close > chikou & tenkan > senkouB"
#> ---------------------  "----------"
#> Strategy cuml return % 11.21
#> Per period mean ret %  0.0597
#> Periods in market      20
#> Total trades           4
#> Average trade length   5
#> Trade success %        75
#> Worst trade ret %      -0.44
#> ---------------------  "----------"
#> Benchmark cuml ret %   -5.24
#> Per period mean ret %  -0.0302
#> Periods in market      178
#> ---------------------  "----------"
#> Direction              "short"
#> Start                  2020-04-19 23:00:00
#> End                    2020-12-23
#> Ticker                 "TKR"
#>                        [,2]
#> Strategy               "high > chikou & tenkan > senkouB"
#> ---------------------  "----------"
#> Strategy cuml return % 11.05
#> Per period mean ret %  0.0589
#> Periods in market      22
#> Total trades           4
#> Average trade length   5.5
#> Trade success %        75
#> Worst trade ret %      0
#> ---------------------  "----------"
#> Benchmark cuml ret %   -5.24
#> Per period mean ret %  -0.0302
#> Periods in market      178
#> ---------------------  "----------"
#> Direction              "short"
#> Start                  2020-04-19 23:00:00
#> End                    2020-12-23
#> Ticker                 "TKR"
#>                        [,3]
#> Strategy               "close > chikou & tenkan > cloudB"
#> ---------------------  "----------"
#> Strategy cuml return % 10.69
#> Per period mean ret %  0.0571
#> Periods in market      24
#> Total trades           4
#> Average trade length   6
#> Trade success %        75
#> Worst trade ret %      -0.44
#> ---------------------  "----------"
#> Benchmark cuml ret %   -5.24
#> Per period mean ret %  -0.0302
#> Periods in market      178
#> ---------------------  "----------"
#> Direction              "short"
#> Start                  2020-04-19 23:00:00
#> End                    2020-12-23
#> Ticker                 "TKR"
Set the argument level = 3 to autostrat()
to test all strategies using an asymmetric combination of up to 2
indicator conditions, i.e. strat() with type = 3.
Note that level 3 autostrat is considered somewhat experimental as the results will tend to have higher sensitivity to the data and in particular the starting conditions.
autostrat(cloud, n = 3, dir = "long", level = "3")
#>                        [,1]
#> Strategy               "senkouB > senkouA x kijun > low"
#> ---------------------  "----------"
#> Strategy cuml return % 2.49
#> Per period mean ret %  0.0138
#> Periods in market      59
#> Total trades           3
#> Average trade length   19.67
#> Trade success %        66.67
#> Worst trade ret %      -2.49
#> ---------------------  "----------"
#> Benchmark cuml ret %   5.53
#> Per period mean ret %  0.0302
#> Periods in market      178
#> ---------------------  "----------"
#> Direction              "long"
#> Start                  2020-04-19 23:00:00
#> End                    2020-12-23
#> Ticker                 "TKR"
#>                        [,2]
#> Strategy               "senkouB > senkouA x tenkan > kijun"
#> ---------------------  "----------"
#> Strategy cuml return % 6.98
#> Per period mean ret %  0.0379
#> Periods in market      82
#> Total trades           3
#> Average trade length   27.33
#> Trade success %        100
#> Worst trade ret %      1.09
#> ---------------------  "----------"
#> Benchmark cuml ret %   5.53
#> Per period mean ret %  0.0302
#> Periods in market      178
#> ---------------------  "----------"
#> Direction              "long"
#> Start                  2020-04-19 23:00:00
#> End                    2020-12-23
#> Ticker                 "TKR"
#>                        [,3]
#> Strategy               "senkouB > high x cloudT > close"
#> ---------------------  "----------"
#> Strategy cuml return % 21.04
#> Per period mean ret %  0.1074
#> Periods in market      130
#> Total trades           4
#> Average trade length   32.5
#> Trade success %        75
#> Worst trade ret %      -0.38
#> ---------------------  "----------"
#> Benchmark cuml ret %   5.53
#> Per period mean ret %  0.0302
#> Periods in market      178
#> ---------------------  "----------"
#> Direction              "long"
#> Start                  2020-04-19 23:00:00
#> End                    2020-12-23
#> Ticker                 "TKR"
mlgrid()
The ML layer provides tools for further developing quantitative ichimoku solutions.
mlgrid() generates a numeric representation of the
relationship between ichimoku cloud chart elements, which represent a
set of stationary price features. Its purpose is to provide a base grid
for machine learning workflows.
The returned object is a data.frame or matrix in a ‘tidy’ format with one observation per row and one feature per column with the target ‘y’ as the first column.
mlgrid() is used to power the autostrat()
and relative() functions.
The 3 basic types of grid are shown below.
‘boolean’ produces a ‘1’ or ‘0’ depending on whether the condition c1_c2 (read c1 > c2) is met:
mlgrid(cloud, y = "logret", dir = "long", type = "boolean", unique = TRUE)[100:105, 1:4]
#>                                 y chikou_close chikou_high chikou_low
#> 2020-10-07 23:00:00  0.0083050685            1           1          1
#> 2020-10-08 23:00:00  0.0015026299            1           1          1
#> 2020-10-11 23:00:00  0.0022497197            1           1          1
#> 2020-10-12 23:00:00 -0.0014992507            1           1          1
#> 2020-10-13 23:00:00 -0.0007504691            1           1          1
#> 2020-10-14 23:00:00  0.0037467260            1           1          1
‘numeric’ produces the numeric difference of c1 - c2:
mlgrid(cloud, y = "ret", dir = "short", type = "numeric", unique = FALSE)[100:105, 1:4]
#>                                 y chikou_close chikou_high chikou_low
#> 2020-10-07 23:00:00 -0.0082706767          3.9         3.8        4.4
#> 2020-10-08 23:00:00 -0.0015015015          5.3         4.6        6.0
#> 2020-10-11 23:00:00 -0.0022471910          3.5         2.9        5.6
#> 2020-10-12 23:00:00  0.0015003751          5.0         3.7        6.4
#> 2020-10-13 23:00:00  0.0007507508          5.1         4.0        6.0
#> 2020-10-14 23:00:00 -0.0037397158          6.7         5.0        7.1
‘z-score’ produces the standard score of a ‘numeric’ type grid:
mlgrid(cloud, y = "ret", dir = "short", type = "z-score", unique = FALSE)[100:105, 1:4]
#>                                 y chikou_close chikou_high chikou_low
#> 2020-10-07 23:00:00 -0.0082706767    0.4046813   0.5057896  0.3499295
#> 2020-10-08 23:00:00 -0.0015015015    0.6349143   0.6370076  0.6106195
#> 2020-10-11 23:00:00 -0.0022471910    0.3389004   0.3581693  0.5454470
#> 2020-10-12 23:00:00  0.0015003751    0.5855786   0.4893873  0.6757920
#> 2020-10-13 23:00:00  0.0007507508    0.6020238   0.5385941  0.6106195
#> 2020-10-14 23:00:00 -0.0037397158    0.8651473   0.7026165  0.7898439
Note: only valid combinations are included within the grid. Any combination involving ‘open’ is excluded as it is in effect a lagged indicator and not contemporaneous. The following trivial or highly-collinear pairs are also excluded: {high, close} ,{low, close}, {low, high}, {cloudT, senkouA}, {cloudB, senkouA}, {cloudT, senkouB}, {cloudB, senkouB}, {cloudB, cloudT}.
The parameter ‘unique’ defaults to TRUE to return only unique combinations of c1 and c2, but can also be set to FALSE to return both c1 > c2 and c2 > c1 where the situation merits.
The ‘y’ column can be switched between log and discrete returns. The date-time index corresponds to when the condition is met at the close for that period. The return is the single-period return achieved by transacting at the immediately following opening price until the next opening price. In this sense, the time periods do not strictly match, but are nevertheless correctly paired.
The calculation of the returns and correct pairing effectively uses up 2 periods, hence in order to obtain the grid for the latest available price data, y must be set to ‘none’, in which case a grid is returned without the target variable.
relative()
Produces a statistical summary of the latest numeric representation of the ichimoku cloud chart relative to historical values contained within the ichimoku object. This can aid in determining whether current trading falls within or outside of normal ranges.
Takes the following optional arguments:
-
order[default FALSE] set to TRUE to order the results by the absolute ‘z-score’. Those with the highest values are listed first -
signif[default 0.2] set a significance threshold for which if ‘p’ is equal or lower, the element will be starred with a ’*’. Note: this value may be freely set and the default of 0.2 is arbitrary with no special significance -
quietlyif set to TRUE, will suppress printing of additional output to the console and return quietly
relative(cloud, signif = 0.4)[1:10, ]
#> Latest: 2020-12-24 00:00:00 | n: 155
#>                mean(X) sd(X) X[n]   res z-score p >= |z| p* E(|res|)|p
#> chikou_close      1.51  6.07 7.00  5.49    0.91     0.39  *       8.53
#> chikou_high       0.79  6.09 6.60  5.81    0.95     0.36  *       8.91
#> chikou_low        2.31  6.12 7.80  5.49    0.90     0.41          8.40
#> chikou_tenkan     1.73  6.15 6.90  5.17    0.84     0.41          8.70
#> chikou_kijun      2.28  5.96 4.90  2.62    0.44     0.63          6.84
#> chikou_senkouA    3.44  6.46 4.75  1.31    0.20     0.89          6.26
#> chikou_senkouB    4.26  5.40 4.35  0.09    0.02     1.00          4.76
#> chikou_cloudT     2.67  6.44 4.35  1.68    0.26     0.84          6.59
#> chikou_cloudB     5.03  5.20 4.75 -0.28   -0.05     0.99          4.60
#> close_tenkan      0.52  1.77 1.70  1.18    0.67     0.52          2.19
‘mean(X)’ is the mean value for each element X, ‘sd(X)’ the standard deviation, and ‘X[n]’ the nth or latest observed values.
‘res’ is the residual X[n] - mean(X) and represents a centred measure of deviation for the latest observed value.
The ‘z-score’ (or standard score) is calculated as res / sd(X) and is a centred and scaled measure of deviation for the latest observed value.
‘p >= |z|’ represents the empirical probability of the latest observed absolute ‘z-score’ or greater.
’p*’ will display a star if ‘p >= |z|’ is less than or equal to the value of the argument ‘signif’.
‘E(|res|)|p’ represents the mean or expected absolute value of ‘res’, conditional upon the absolute ‘z-score’ being greater than equal to the latest observed absolute ‘z-score’. This provides an indication by how much ‘res’ might increase in more extreme cases.
Strategy Summary Specification
---
Strategy cuml return %: The (discrete) percentage return achieved by pursuing the strategy, assuming all returns are compounded. This measure is equivalent to the sum of log returns converted back into a discrete return
Per period mean ret %: The percentage return (above) divided by the periods in market (below)
Periods in market: The number of periods (days, or whatever the periodicity of the data is) in the market
Total trades: Total number of trades to implement the strategy. Note that each trade requires 2 transactions, one to enter the trade and one to exit. Note: generating the benchmark return would imply one trade
Average trade length: Periods in Market (above) divided by total trades (above)
Trade success %: Number of trades where the return is strictly greater than zero divided by the total number of trades
Worst trade ret %: The (discrete) percentage return of the worst-performing trade
---
Benchmark cuml return %: The (discrete) percentage return achieved using a ‘buy and hold’ strategy
Per period mean ret %: The percentage return (above) divided by the periods in market (below)
Periods in market: The number of periods (days, or whatever the periodicity of the data is) from the ‘start’ to ‘end’ dates
---
Ticker: The ticker saved in the ichimoku object
Start/end: The start and end dates of the backtest. These dates will differ for different cloud lines depending on how many periods it takes to calculate them
Direction: ‘long’ or ‘short’ trade direction as can be set via the argument ‘dir’. Only single direction strategies are considered