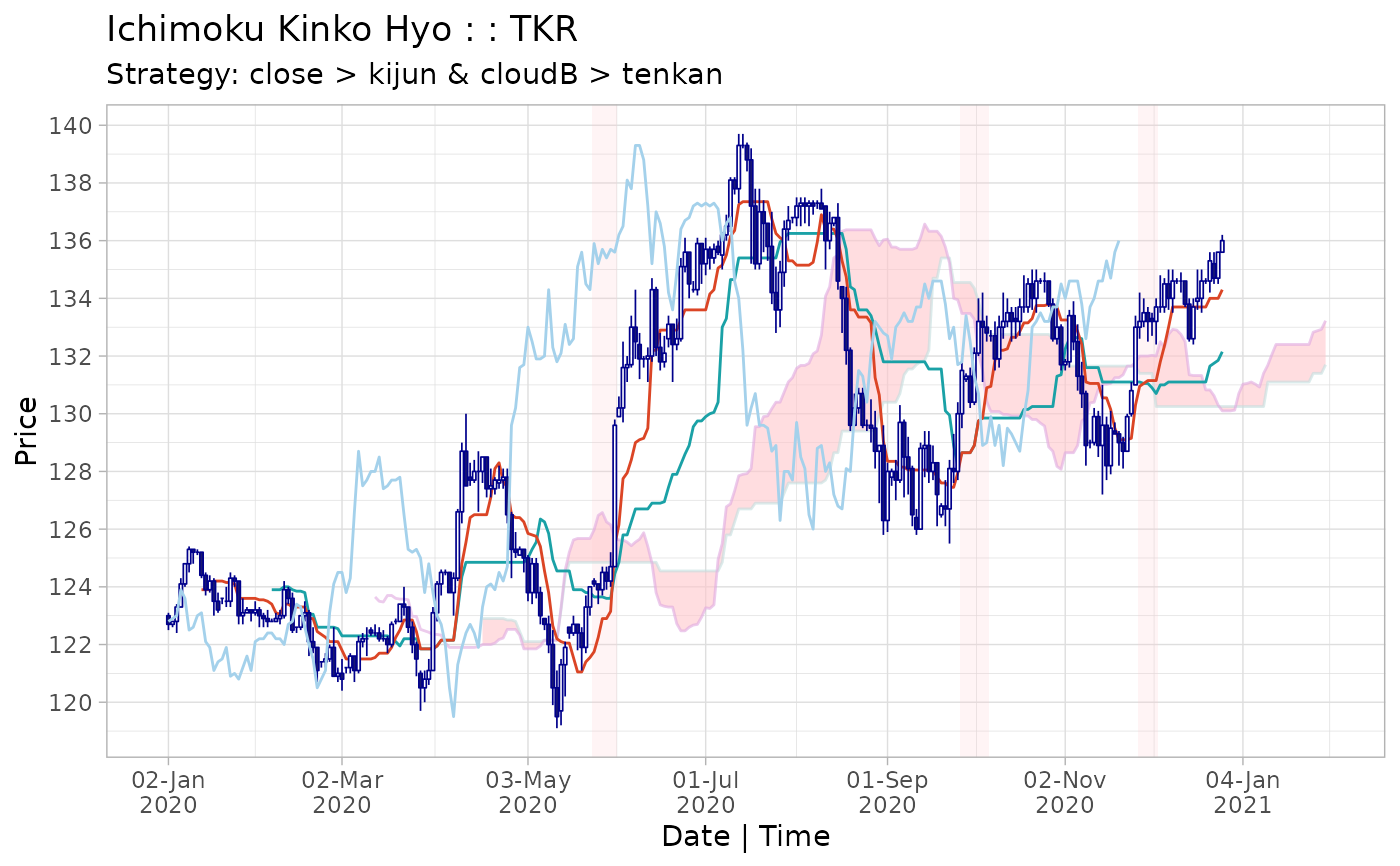
Create custom strategies from combining existing strategies contained in ichimoku objects 's1' and 's2' to form 's1 & s2'.
Details
The combined strategy ‘s1 & s2’ means indicator conditions in ‘s1’ and ‘s2’ have to be met simulateneously for a trade position to be taken.
The boolean values showing whether these conditions are met are stored in the ‘cond’ column.
The strategy summary may be accessed by the summary() method for
ichimoku objects or via look.
Further Details
Please refer to the strategies vignette by calling:
vignette("strategies", package = "ichimoku")
Examples
cloud <- ichimoku(sample_ohlc_data, ticker = "TKR")
strat1 <- strat(cloud, c1 = "close", c2 = "kijun")
strat2 <- strat(cloud, c1 = "cloudB", c2 = "tenkan")
cstrat <- stratcombine(strat1, strat2)
summary(cstrat)
#>                        [,1]
#> Strategy               "close > kijun & cloudB > tenkan"
#> ---------------------  "----------"
#> Strategy cuml return % 7.32
#> Per period mean ret %  0.0397
#> Periods in market      18
#> Total trades           3
#> Average trade length   6
#> Trade success %        100
#> Worst trade ret %      0.53
#> ---------------------  "----------"
#> Benchmark cuml ret %   5.53
#> Per period mean ret %  0.0302
#> Periods in market      178
#> ---------------------  "----------"
#> Direction              "long"
#> Start                  2020-04-19 23:00:00
#> End                    2020-12-23
#> Ticker                 "TKR"
plot(cstrat)