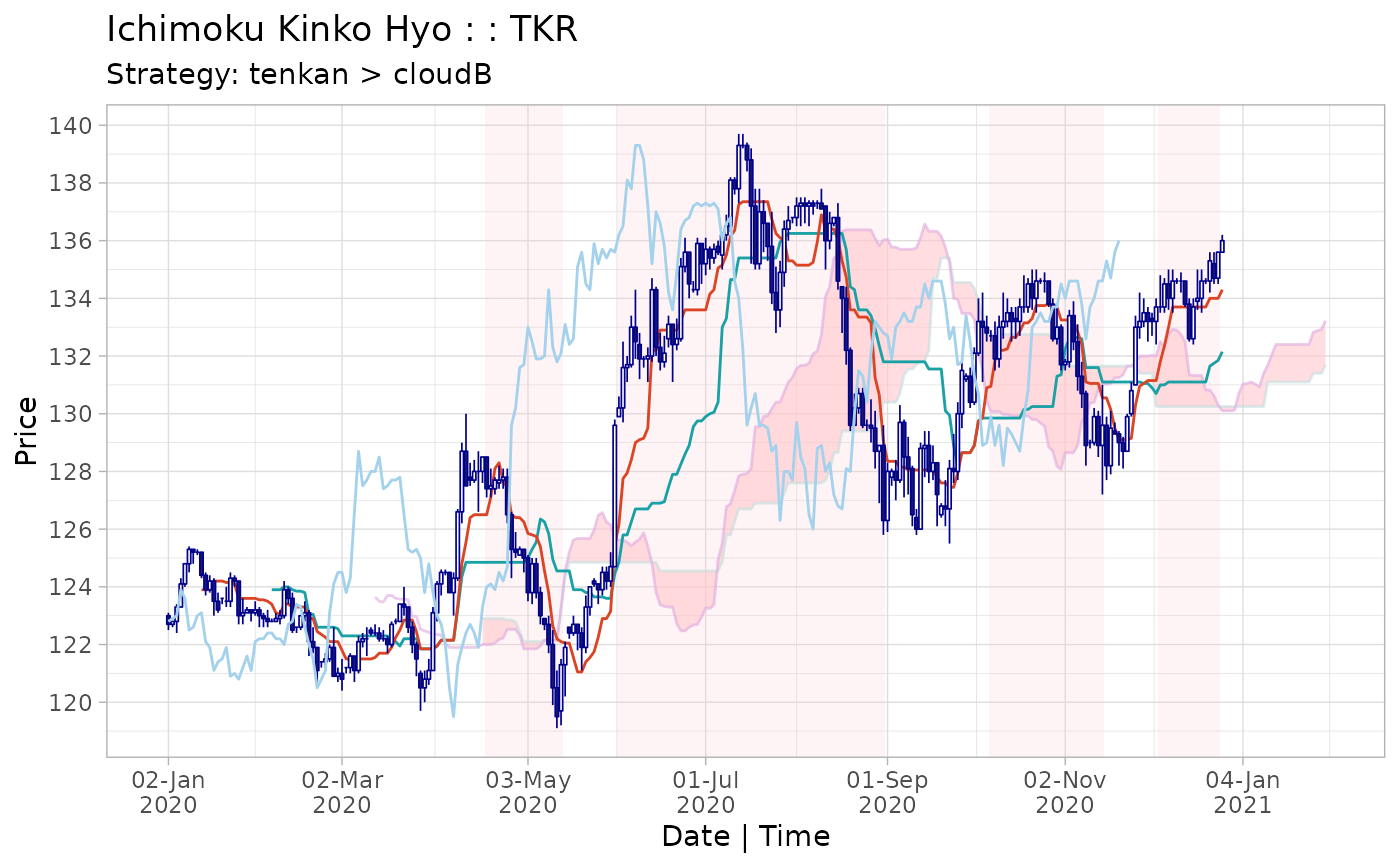
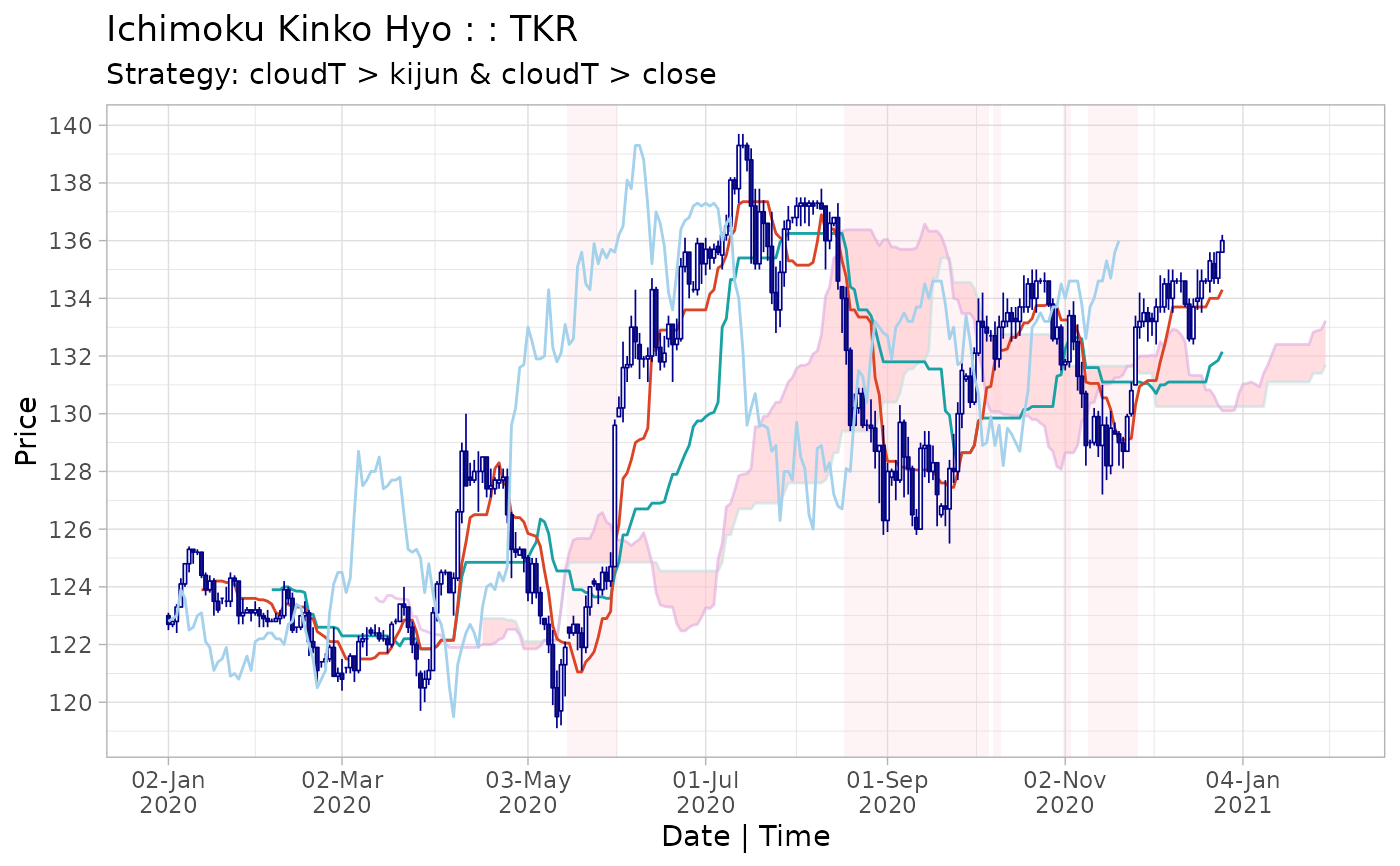
Create ichimoku cloud strategies using the indicator condition 'long / short while c1 > c2'. Complex strategies can be formulated as combined 'c1 > c2 & c3 > c4' (both conditions must be satisfied) or asymmetric 'c1 > c2 x c3 > c4' (where 'c1 > c2' denotes the entry and 'c3 > c4' the exit indicator).
Usage
strat(
  x,
  c1 = c("close", "chikou", "open", "high", "low", "tenkan", "kijun", "senkouA",
    "senkouB", "cloudT", "cloudB"),
  c2 = c("tenkan", "kijun", "senkouA", "senkouB", "cloudT", "cloudB", "chikou", "close",
    "open", "high", "low"),
  c3 = c("close", "chikou", "open", "high", "low", "tenkan", "kijun", "senkouA",
    "senkouB", "cloudT", "cloudB"),
  c4 = c("tenkan", "kijun", "senkouA", "senkouB", "cloudT", "cloudB", "chikou", "close",
    "open", "high", "low"),
  dir = c("long", "short"),
  type = 2
)
Arguments
- x
an ichimoku object.
- c1
[default 'close'] column name specified as a string.
- c2
[default 'tenkan'] column name specified as a string.
- c3
(optional) column name specified as a string.
- c4
(optional) column name specified as a string.
- dir
[default 'long'] trade direction, either ‘long’ or ‘short’.
- type
[default 2] if ‘c3’ and ‘c4’ are specified, type 2 will create the combined strategy ‘c1 > c2 & c3 > c4’ whilst type 3 will create the asymmetric strategy ‘c1 > c2 x c3 > c4’.
Details
The following assumption applies to all strategies: confirmation of whether a condition is satisfied is received at the ‘close’ of a particular period, and a transaction is initiated at the immediately following ‘open’. All transactions occur at the ‘open’.
By default, the periods in which the strategy results in a position is
shaded on the ichimoku cloud chart and the strategy is printed as the
chart message (if not otherwise specified). To turn off this behaviour,
pass the strat = FALSE argument to plot() or iplot().
Ichimoku Object Specification for Strategies
The ichimoku object is augmented with the following additional elements:
Columns [numeric]:
$cond: a boolean vector if the indicator condition is met$posn: a boolean vector indicating if a position is held$txn: a vector representing the transactions to implement the position (1 = enter position, -1 = exit position)$logret: a vector of log returns$slogret: a vector of log returns for the strategy$ret: a vector of discrete returns$sret: a vector of of discrete returns for the strategy
Attributes:
$strat: the strategy summary [matrix]
The strategy summary may be accessed by the summary() method for
ichimoku objects or via look.
Complex Strategies
For complex strategies: 's1' denotes the strategy 'c1 > c2' and 's2' denotes the strategy 'c3 > c4'.
Combined strategy 's1 & s2': indicator conditions in 's1' and 's2' have to be met simulateneously for a position to be taken. The column
$condwill show when both conditions are metAsymmetric strategy 's1 x s2': indicator condition in 's1' has to be met to enter a position, and indicator condition in 's2' to exit a position. These rules are applied recursively over the length of the data. The column
$condwill show when the indicator condition is met in 's1'
Further Details
Please refer to the strategies vignette by calling:
vignette("strategies", package = "ichimoku")
Examples
cloud <- ichimoku(sample_ohlc_data, ticker = "TKR")

strat <- strat(cloud, c1 = "tenkan", c2 = "cloudB", dir = "short")
summary(strat)
#>                        [,1]
#> Strategy               "tenkan > cloudB"
#> ---------------------  "----------"
#> Strategy cuml return % 10
#> Per period mean ret %  0.0536
#> Periods in market      127
#> Total trades           4
#> Average trade length   31.75
#> Trade success %        75
#> Worst trade ret %      -1.42
#> ---------------------  "----------"
#> Benchmark cuml ret %   -5.24
#> Per period mean ret %  -0.0302
#> Periods in market      178
#> ---------------------  "----------"
#> Direction              "short"
#> Start                  2020-04-19 23:00:00
#> End                    2020-12-23
#> Ticker                 "TKR"
plot(strat)


strat2 <- strat(cloud, c1 = "cloudT", c2 = "kijun", c3 = "cloudT", c4 = "close")
summary(strat2)
#>                        [,1]
#> Strategy               "cloudT > kijun & cloudT > close"
#> ---------------------  "----------"
#> Strategy cuml return % 9.82
#> Per period mean ret %  0.0527
#> Periods in market      63
#> Total trades           5
#> Average trade length   12.6
#> Trade success %        80
#> Worst trade ret %      -0.97
#> ---------------------  "----------"
#> Benchmark cuml ret %   5.53
#> Per period mean ret %  0.0302
#> Periods in market      178
#> ---------------------  "----------"
#> Direction              "long"
#> Start                  2020-04-19 23:00:00
#> End                    2020-12-23
#> Ticker                 "TKR"
plot(strat2)

