Create an ichimoku object containing values for all components of the Ichimoku Kinko Hyo cloud chart. The object encapsulates a date-time index, OHLC pricing data, candle direction, the cloud lines Tenkan-sen, Kijun-sen, Senkou span A, Senkou span B and Chikou span, as well as values for the cloud top and cloud base.
Usage
ichimoku(x, ticker, periods = c(9L, 26L, 52L), keep.data = FALSE, ...)

# S3 method for class 'ichimoku'
ichimoku(x, ticker, periods = c(9L, 26L, 52L), keep.data = FALSE, ...)

# S3 method for class 'xts'
ichimoku(x, ticker, periods = c(9L, 26L, 52L), keep.data = FALSE, ...)

# S3 method for class 'data.frame'
ichimoku(x, ticker, periods = c(9L, 26L, 52L), keep.data = FALSE, ...)

# S3 method for class 'matrix'
ichimoku(x, ticker, periods = c(9L, 26L, 52L), keep.data = FALSE, ...)

# Default S3 method
ichimoku(x, ticker, periods = c(9L, 26L, 52L), keep.data = FALSE, ...)
Arguments
- x
a data.frame or other compatible object, which includes xts, data.table, tibble, and matrix.
- ticker
(optional) specify a ticker to identify the instrument, otherwise this is set to the name of the input object.
- periods
[default c(9L, 26L, 52L)] a vector defining the length of periods used for the cloud. This parameter shoud not normally be modified as using other values would be invalid in the context of traditional ichimoku analysis.
- keep.data
[default FALSE] set to TRUE to retain additional data present in the input object as additional columns and/or attributes.
- ...
additional arguments, for instance ‘holidays’, passed along to
tradingDaysfor calculating the future cloud on daily data.
Details
Calling an ichimoku object automatically invokes its print method, which by default produces a printout of the data to the console as well as a plot of the cloud chart to the graphical device.
For further options, use plot() on the returned ichimoku object to
pass further arguments for customising the chart. Use iplot() for
interactive charting.
Where an ichimoku object is passed to ichimoku(), the ichimoku
object is re-calculated using the OHLC pricing data contained within.
Ichimoku Object Specification
Index:
index(object): date-time index [POSIXct]
Columns [numeric]:
object$open: opening price$high: high price$low: low price$close: closing price$cd: candle direction (-1 = down, 0 = flat, 1 = up)$tenkan: Tenkan-sen$kijun: Kijun-sen$senkouA: Senkou span A$senkouB: Senkou span B$chikou: Chikou span$cloudT: cloud Top (max of senkouA, senkouB)$cloudB: cloud Base (min of senkouA, senkouB)
Attributes:
attributes(object)$periods: parameters used to calculate the cloud [integer vector of length 3]$periodicity: periodicity of the data in seconds [numeric]$ticker: instrument identifier [character]
Further Details
ichimoku() requires OHLC (or else HLC) price data as input to
calculate the cloud chart values.
If only single series price data is supplied, a pseudo OHLC series is generated and a pseudo cloud chart is returned.
A faster technical utility version of this function is available in
.ichimoku for use when the data is already in the required
format.
Please refer to the reference vignette by calling:
vignette("reference", package = "ichimoku")
Examples
TKR <- sample_ohlc_data
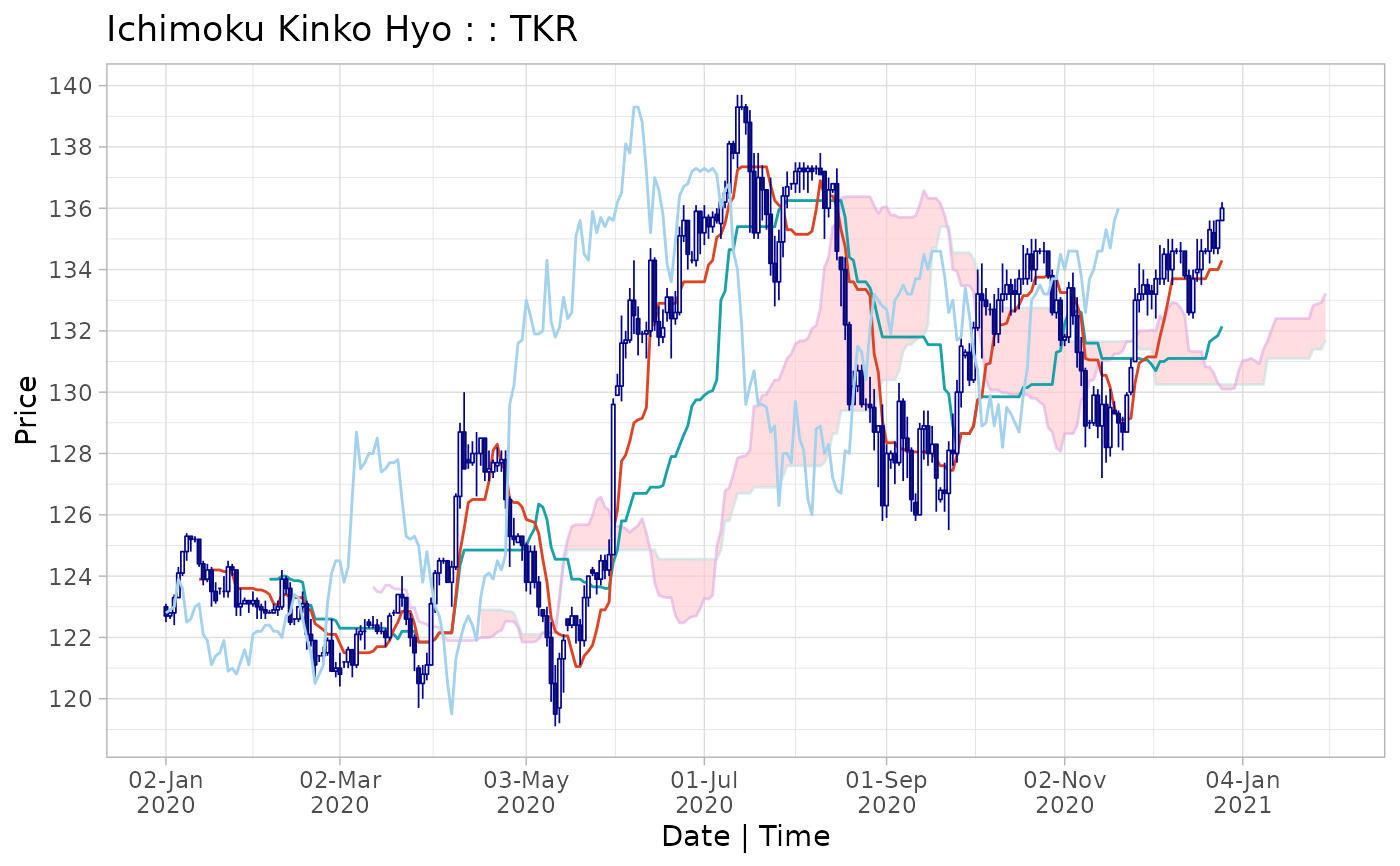
cloud <- ichimoku(TKR)
cloud
#> ichimoku [ more() to display more rows | look() to inspect attributes ]
#> object
#> open high low close cd tenkan kijun senkouA senkouB chikou
#> 2020-01-02 123.0 123.1 122.5 122.7 -1 NA NA NA NA 122.8
#> 2020-01-03 122.7 122.8 122.6 122.8 1 NA NA NA NA 122.9
#> 2020-01-06 122.8 123.4 122.4 123.3 1 NA NA NA NA 123.0
#> 2020-01-07 123.3 124.3 123.3 124.1 1 NA NA NA NA 123.9
#> 2020-01-08 124.1 124.8 124.0 124.8 1 NA NA NA NA 123.6
#> 2020-01-09 124.8 125.4 124.5 125.3 1 NA NA NA NA 122.5
#> 2020-01-10 125.3 125.3 124.8 125.2 -1 NA NA NA NA 122.6
#> 2020-01-13 125.2 125.3 125.1 125.2 0 NA NA NA NA 123.0
#> 2020-01-14 125.2 125.2 124.3 124.4 -1 123.90 NA NA NA 123.1
#> 2020-01-15 124.4 124.5 123.7 123.9 -1 123.90 NA NA NA 122.1
#> 2020-01-16 123.9 124.4 123.8 124.2 1 123.90 NA NA NA 121.9
#> 2020-01-17 124.2 124.3 123.0 123.5 -1 124.20 NA NA NA 121.1
#> 2020-01-20 123.5 123.8 123.1 123.2 -1 124.20 NA NA NA 121.4
#> 2020-01-21 123.6 123.6 123.4 123.6 0 124.20 NA NA NA 121.5
#> 2020-01-22 123.5 124.0 123.3 123.5 0 124.15 NA NA NA 121.9
#> 2020-01-23 123.5 124.5 123.3 124.3 1 124.15 NA NA NA 120.9
#> 2020-01-24 124.3 124.4 124.0 124.2 -1 124.10 NA NA NA 121.0
#> 2020-01-27 124.2 124.2 122.7 123.0 -1 123.60 NA NA NA 120.8
#> 2020-01-28 123.0 123.6 122.7 123.1 1 123.60 NA NA NA 121.2
#> 2020-01-29 123.1 123.3 123.1 123.2 1 123.60 NA NA NA 121.6
#> 2020-01-30 123.2 123.2 122.8 123.1 -1 123.60 NA NA NA 121.1
#> 2020-01-31 123.1 123.5 123.0 123.2 1 123.60 NA NA NA 122.1
#> 2020-02-03 123.2 123.3 122.6 123.0 -1 123.55 NA NA NA 122.2
#> 2020-02-04 123.0 123.1 122.6 122.9 -1 123.55 NA NA NA 122.2
#> 2020-02-05 122.9 123.2 122.6 122.8 -1 123.50 NA NA NA 122.4
#> 2020-02-06 122.8 122.9 122.8 122.8 0 123.40 123.90 NA NA 122.4
#> cloudT cloudB
#> 2020-01-02 NA NA
#> 2020-01-03 NA NA
#> 2020-01-06 NA NA
#> 2020-01-07 NA NA
#> 2020-01-08 NA NA
#> 2020-01-09 NA NA
#> 2020-01-10 NA NA
#> 2020-01-13 NA NA
#> 2020-01-14 NA NA
#> 2020-01-15 NA NA
#> 2020-01-16 NA NA
#> 2020-01-17 NA NA
#> 2020-01-20 NA NA
#> 2020-01-21 NA NA
#> 2020-01-22 NA NA
#> 2020-01-23 NA NA
#> 2020-01-24 NA NA
#> 2020-01-27 NA NA
#> 2020-01-28 NA NA
#> 2020-01-29 NA NA
#> 2020-01-30 NA NA
#> 2020-01-31 NA NA
#> 2020-02-03 NA NA
#> 2020-02-04 NA NA
#> 2020-02-05 NA NA
#> 2020-02-06 NA NA
#> [ reached 'max' / getOption("max.print") -- omitted 27 rows ]
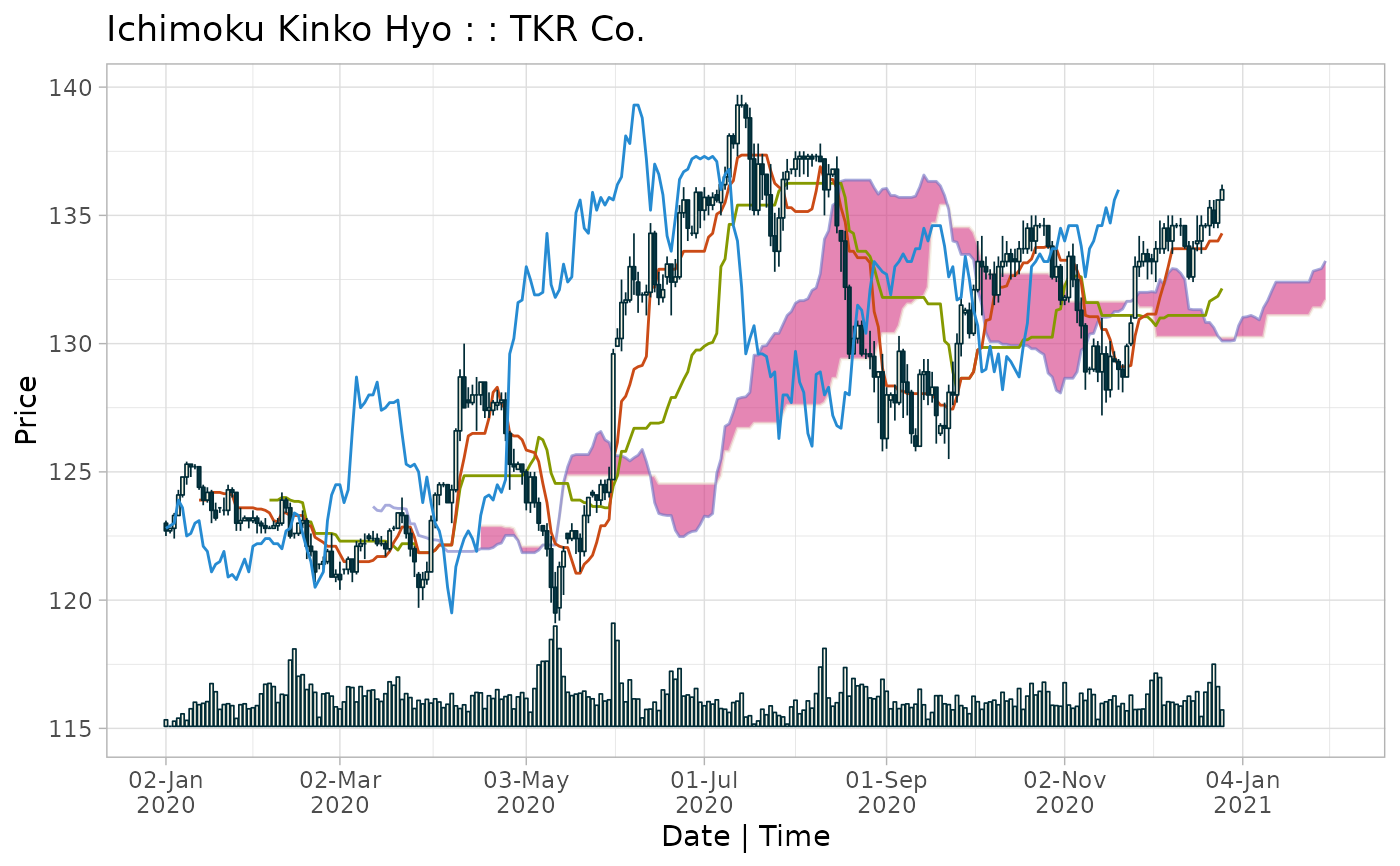
 kumo <- ichimoku(TKR, ticker = "TKR Co.", periods = c(9, 26, 52), keep.data = TRUE)
summary(kumo)
#> ichimoku object with dimensions (281, 13)
#>
#> Max: 2020-07-13 23:00:00 [139.7]
#> Start: 2020-01-02 00:00:00 [123] End: 2020-12-24 00:00:00 [136]
#> Min: 2020-05-12 23:00:00 [119.1]
#>
#> Cloud periods: 9 26 52
#> Periodicity: 1 days
#> Ticker: TKR Co.
print(kumo, plot = FALSE, rows = 10)
#> ichimoku [ more() to display more rows | look() to inspect attributes ]
#> object
#> open high low close cd tenkan kijun senkouA senkouB chikou
#> 2020-01-02 123.0 123.1 122.5 122.7 -1 NA NA NA NA 122.8
#> 2020-01-03 122.7 122.8 122.6 122.8 1 NA NA NA NA 122.9
#> 2020-01-06 122.8 123.4 122.4 123.3 1 NA NA NA NA 123.0
#> 2020-01-07 123.3 124.3 123.3 124.1 1 NA NA NA NA 123.9
#> 2020-01-08 124.1 124.8 124.0 124.8 1 NA NA NA NA 123.6
#> 2020-01-09 124.8 125.4 124.5 125.3 1 NA NA NA NA 122.5
#> 2020-01-10 125.3 125.3 124.8 125.2 -1 NA NA NA NA 122.6
#> 2020-01-13 125.2 125.3 125.1 125.2 0 NA NA NA NA 123.0
#> 2020-01-14 125.2 125.2 124.3 124.4 -1 123.9 NA NA NA 123.1
#> 2020-01-15 124.4 124.5 123.7 123.9 -1 123.9 NA NA NA 122.1
#> cloudT cloudB volume
#> 2020-01-02 NA NA 1875
#> 2020-01-03 NA NA 1479
#> 2020-01-06 NA NA 1792
#> 2020-01-07 NA NA 1977
#> 2020-01-08 NA NA 2239
#> 2020-01-09 NA NA 1842
#> 2020-01-10 NA NA 2548
#> 2020-01-13 NA NA 2946
#> 2020-01-14 NA NA 2796
#> 2020-01-15 NA NA 2879
#> [ reached 'max' / getOption("max.print") -- omitted 11 rows ]
plot(kumo, theme = "solarized", type = "bar", custom = "volume")
kumo <- ichimoku(TKR, ticker = "TKR Co.", periods = c(9, 26, 52), keep.data = TRUE)
summary(kumo)
#> ichimoku object with dimensions (281, 13)
#>
#> Max: 2020-07-13 23:00:00 [139.7]
#> Start: 2020-01-02 00:00:00 [123] End: 2020-12-24 00:00:00 [136]
#> Min: 2020-05-12 23:00:00 [119.1]
#>
#> Cloud periods: 9 26 52
#> Periodicity: 1 days
#> Ticker: TKR Co.
print(kumo, plot = FALSE, rows = 10)
#> ichimoku [ more() to display more rows | look() to inspect attributes ]
#> object
#> open high low close cd tenkan kijun senkouA senkouB chikou
#> 2020-01-02 123.0 123.1 122.5 122.7 -1 NA NA NA NA 122.8
#> 2020-01-03 122.7 122.8 122.6 122.8 1 NA NA NA NA 122.9
#> 2020-01-06 122.8 123.4 122.4 123.3 1 NA NA NA NA 123.0
#> 2020-01-07 123.3 124.3 123.3 124.1 1 NA NA NA NA 123.9
#> 2020-01-08 124.1 124.8 124.0 124.8 1 NA NA NA NA 123.6
#> 2020-01-09 124.8 125.4 124.5 125.3 1 NA NA NA NA 122.5
#> 2020-01-10 125.3 125.3 124.8 125.2 -1 NA NA NA NA 122.6
#> 2020-01-13 125.2 125.3 125.1 125.2 0 NA NA NA NA 123.0
#> 2020-01-14 125.2 125.2 124.3 124.4 -1 123.9 NA NA NA 123.1
#> 2020-01-15 124.4 124.5 123.7 123.9 -1 123.9 NA NA NA 122.1
#> cloudT cloudB volume
#> 2020-01-02 NA NA 1875
#> 2020-01-03 NA NA 1479
#> 2020-01-06 NA NA 1792
#> 2020-01-07 NA NA 1977
#> 2020-01-08 NA NA 2239
#> 2020-01-09 NA NA 1842
#> 2020-01-10 NA NA 2548
#> 2020-01-13 NA NA 2946
#> 2020-01-14 NA NA 2796
#> 2020-01-15 NA NA 2879
#> [ reached 'max' / getOption("max.print") -- omitted 11 rows ]
plot(kumo, theme = "solarized", type = "bar", custom = "volume")